
WebMonitor™
Shipping
1-3 days delivery
WebMonitor™
Senceives WebMonitor™ is an easy-to-use, web-based data access system that provides customers with a user-friendly tool for managing Senceive monitoring solutions that have been deployed in the field.
WebMonitor is highly configurable to suit the details of your monitoring project. Customizable website images, calculations, and alert triggers are just the beginning of what's possible. Role-based access control and HTTPS are used to ensure your data remains secure.
Various options are available to transfer WebMonitor data to other systems, including periodic FTP (S) uploads in various formats and an HTTP API.
Description Web Monitor
- Customizable site images or maps for displaying overlaid sensor data
- Interactive data visualization, including time series and beam / IPI chain style plots
- Sophisticated warning engine
- Multiple trigger levels
- SMS and/or email alerts
- No data lock-in
- Automatic FTP with various file formats available
- HTTP API for sample data
- Easy to download datasets in CSV format
- Role-based access to user control
- Reduces the number of accounts each user needs
- The roles can be configured to suit your organization
- All modern browsers are supported
- You don't need to license and manage your own servers
- No per user licensing
- Custom branding available
Architecture
WebMonitor is a service powered by Senceive on the Microsoft Azure cloud platform. The WebMonitor system consists of three main components: an Azure SQL Database that stores all configuration, sample data, and diagnostic information for all sites; the web client part based on the enterprise-class Microsoft ASP.NET platform; and a virtual machine running the WebMonitor service. The WebMonitor service is responsible for all background activities, including:
- Manage incoming test and diagnostic data from field equipment
- Process incoming data samples and images
- conversion to technical units
- apply all configured baseline offsets
- apply all configured data filtering
- Perform virtual sensor calculations (derived sensors, aggregate sensors and sensor chains)
- Notice of sample data
- Network health notification
- Maintain FlatMesh nodes network intelligence configuration
- Regularly upload data to external servers via FTP / FTPS
Data warning
Up to five different alert trigger levels with user-configurable colors can be set for a website in seconds.
Notification about network health
To help you respond to problems in the system, WebMonitor can automatically send emails to any address list if a device is no longer communicating with the system. It can also send notifications if a gateway's battery voltage drops below a warning threshold to allow time to respond before service is lost.
Custom branding
WebMonitor can be customized, from the login page to the warning messages. This is achieved through configuration options for the client organization. no software development work required.
Monitor using Site Monitor
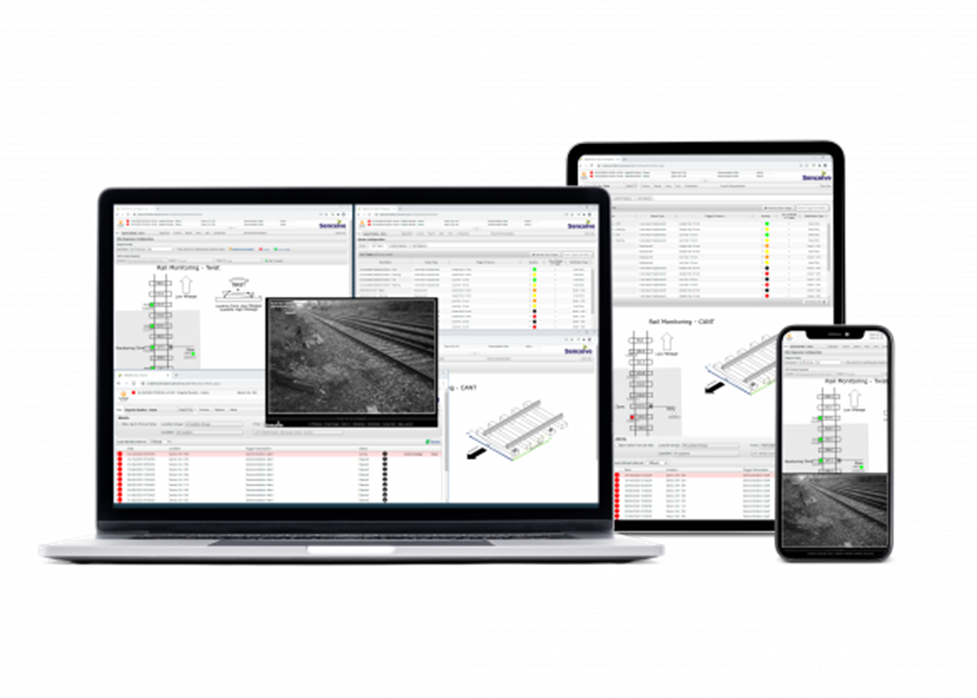
Site Monitor is customized with a graphic that represents the website. It can be a map, technical drawing or simply a photograph. Sensor icons are superimposed on this image and show the last reported value for that location along with its current alarm status (eg clear / green / yellow / red for multi-level alarm triggers). Clicking on the location icon gives you quick direct access to graphs for that sensor.
>>
Data Reports
On the Data Reports page, the user can quickly generate time series graphs and downloadable CSV files for any combination of locations and sensor types. Graphs enable interactive zooming and quick dataset selection for frustration-free data exploration. Notification trigger levels are shown as shaded backgrounds.
>>
Sensor chain reports
The dedicated Sensor Chain Reports page is used to display data from virtual sensors in the sensor chain. Graphs allow interactive zooming. Notification trigger levels are shown as shaded backgrounds. Data can be exported to a downloadable CSV file with a single click.

Image viewer for camera
Images from all cameras on the site will be displayed on this page. Individual images can be viewed under zoom or downloaded with a couple of clicks.
>>
Notification history
The Notifications page displays the complete history of active, acknowledged and cleared notifications for the site. Records of the user and confirmation and purge time are available for each record. The panel at the top of each page shows currently active alerts for all websites so you never miss a thing.
>>
Configuration: Notifications
Notification triggers are highly configurable, with the ability to configure complex notification rules in a clear and simple way.
>>
Configuration: Site Monitor
Site Monitor configuration is done using an easy-to-use drag-and-drop interface.
>>